Linear equations in the coordinate plane
A linear equation is an equation with two variables whose graph is a line. The graph of the linear equation is a set of points in the coordinate plane that all are solutions to the equation. If all variables represent real numbers one can graph the equation by plotting enough points to recognize a pattern and then connect the points to include all points.
If you want to graph a linear equation you have to have at least two points, but it's usually a good idea to use more than two points. When choosing your points try to include both positive and negative values as well as zero.
Example
Graft the function y = x + 2
Begin by choosing a couple of values for x e.g. -2, -1, 0, 1 and 2 and calculate the corresponding y values.
| X | Y = x + 2 | Ordered pair |
| -2 | -2 + 2 = 0 | (-2, 0) |
| -1 | -1 + 2 = 1 | (-1, 1) |
| 0 | 0 + 2 = 2 | (0, 2) |
| 1 | 1 + 2 = 3 | (1, 3) |
| 2 | 2 + 2 = 4 | (2, 4) |
Now you can just plot the five ordered pairs in the coordinate plane
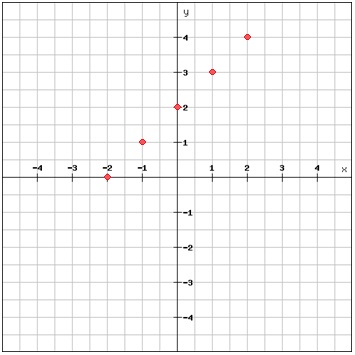
At the moment this is an example of a discrete function. A discrete function consists of isolated points.
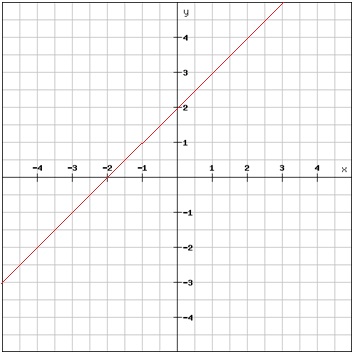
By drawing a line through all points and while extending the line in both directions we get the opposite of a discrete function, a continuous function, which has an unbroken graph.
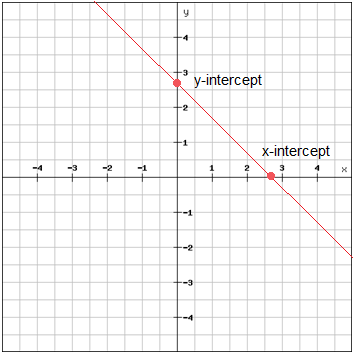
If you only want to use two points to determine your line you can use the two points where the graph crosses the axes. The point in which the graph crosses the x-axis is called the x-intercept and the point in which the graph crosses the y-axis is called the y-intercept. The x-intercept is found by finding the value of x when y = 0, (x, 0), and the y-intercept is found by finding the value of y when x = 0, (0, y).
The standard form of a linear equation is
$$Ax+By = C,\: \: A,B\neq 0$$
Before you can graph a linear equation in its standard form you first have to solve the equation for y.
$$2y-4x=8$$
$$2y-4x\, {\color{green} {+\, 4x}}=8\, {\color{green} {+\, 4x}}$$
$$2y=4x+8$$
$$\frac{2y}{{\color{green} 2}}=\frac{4x}{{\color{green} 2}}+\frac{8}{{\color{green} 2}}$$
$$y=2x+4$$
From here you can graph the equation as we did in the example above.
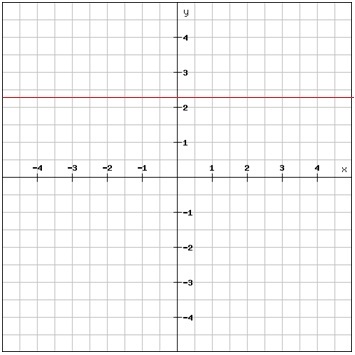
The graph of y = a is a horizontal line where the line passes through the point (0, a)
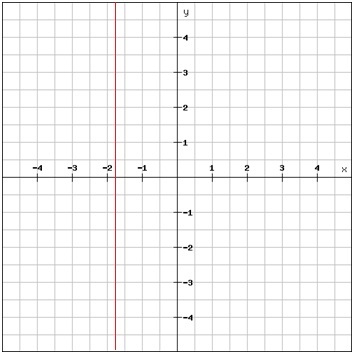
Whereas the graph of x = a is a vertical line that passes through the point (a, 0)
Video lesson
Draw the graph of the linear equation y =3x - 2