Exponential functions
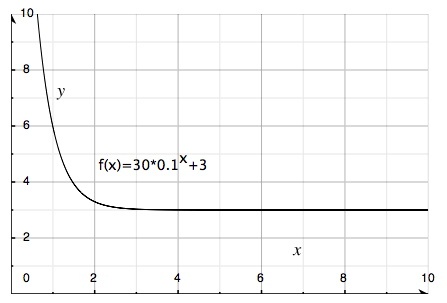
Until now we have dealt with various calculations of functions and equations where x is either in the base or the exponent. When x is the exponent the function is known as an exponential function. We will now see how an exponential function appears graphically. As with any function whatsoever, an exponential function may be correspondingly represented on a graph. We will begin with two functions as examples - one where the base is greater than 1 and the other where the base is smaller than is smaller than 1.
In this function the base is 2. The function is inclining.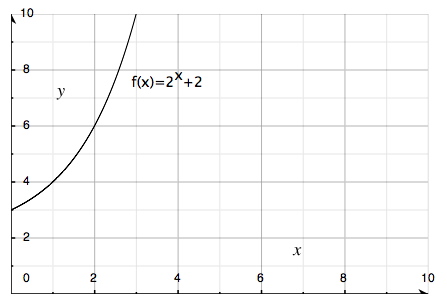
In this function the base is 0.1. The function is declining.
An exponential function may generally be written as:
$$y=C\cdot a^{x}$$
The following graph depicts four different curves indicating how an exponential function behaves depending on whether C and a are positive or negative. The curves are identical but inverted in the various quadrants:
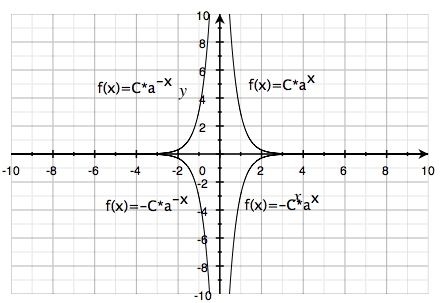
No curve ever intersects the x-axis but only approaches it infinitely.
Video lesson
Show how to rewrite the given expression
$$0.25^{x}=(\frac{1}{4})^{x}=4^{-x}$$