Graph inequalities
In order to graph an inequality we work in 3 steps:
First we graph our boundaries; we dash the line if the values on the line are not included in the boundary. If the values are included we draw a solid line as before.
Second we test a point in each region. If one point on one side of the line satisfies our inequality, the coordinates of all the points on the same side of the line will satisfy the same inequality.
Last we shade the region whose coordinates satisfy our inequality.
Example
Graph
$$y> | x | +1$$
Our absolute value function has two conditions to consider:
$$when\; x<0\; and\; when\; x>0$$
i.e. when x is either positive or negative
$$y>-x+1$$
$$y>x+1$$
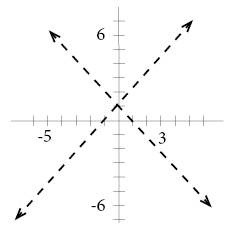
As the first step we graph our boundaries, the lines will be dashed since the values on the lines are not included in the boundaries:
Second we should test one point, we choose to test (0,2):
$$y> | x | +1$$
$$2> | 0 | +1$$
$$2>0+1$$
$$2>1$$
$$True$$
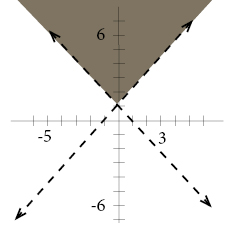
Since our point satisfies our inequality, the coordinates of all the points on the same side of the lines will satisfy the same inequality.
As a last step we shade this region:
Video lesson
Graph
$$f(x) < |x-1|-7$$