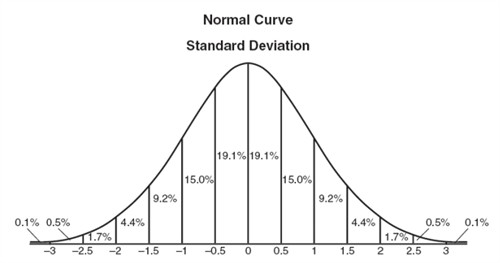
Standard deviation and normal distribution
Standard deviation is a widely used measurement of variability or diversity used in statistics and probability theory. It shows how much variation or "dispersion" there is from the "average" (mean, or expected value). A low standard deviation indicates that the data points tend to be very close to the mean, whereas high standard deviation indicates that the data is spread out over a large range of values.
From a set of data with n values, where x1 represents the first term and xn represent the nth term, if xm represents the mean, then the standard deviation can be found as follows:
$$SD=\sqrt{\frac{(x_{1}-x_{m})^{2}+(x_{2}-x_{m})^{2}+....+(x_{n}-x_{m})^{2}}{n}}$$
A normal distribution is a very important statistical data distribution pattern occurring in many natural phenomena. Random variation conforms to a particular probability distribution known as the normal distribution, which is the most commonly observed probability distribution. Fifty percent of the distribution lies to the left of the mean and fifty percent lies to the right of the mean.

Video lesson
How many percent lies within two standard deviations of the mean?
