Exponential growth functions
We have dealt with linear functions earlier. All types of equations containing two unknown (x and y) variables may be inserted in a coordinate system. These types of equations are known as functions. A straight line is known as a linear function.
The function need not necessarily respond like a straight line equation. For example: If we have $50 000 deposited in the bank, and receive a 2 % interest annually, our investment shall increase as follows:
| Year | Capital | Interest | Sum |
| 1 | 50 000 | 50 000 · 0.02 = 1 000 | 51 000 |
| 2 | 51 000 | 51 000 · 0.02 = 1 020 | 52 020 |
| 3 | 52 020 | 52 020 · 0.02 = 1040.40 | 53 060.40 |
Compare that with what we would have with a linear increase (2%):
| Year | Capital | Increase | Sum |
| 1 | 50 000 | 50 000 · 0.02 = 1000 | 51 000 |
| 2 | 51 000 | 50 000 · 0.02 = 1000 | 52 000 |
| 3 | 52 000 | 50 000 · 0.02 = 1000 | 53 000 |
In this case we may note that the increase was constant each year. The investment may be described as:
$$y=50000+1000x$$
where x equals the number of years.
However in the first case, the structure proceeds as:
$$y=5000\cdot 1.02^{x}$$
$$investment \:\: after \: x \: number \: of\: years$$
$$= initial\: capital \cdot compound\: interest^{x \: number \: of \: years}$$
Here we have an x-variable in the exponent. The interest and thus also the function are exponentials.
Now we shall examine the differences displayed with the functions in our example above in a coordinate system.
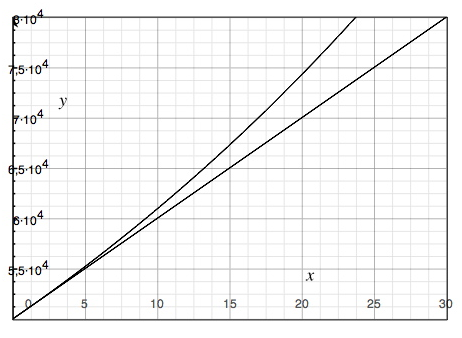
The lower straight line represents the linear increase and the upper bowed curve represents the exponential increase. In other words it is more profitable to have a compounded interest than a fixed return.
An exponential function is a nonlinear function that has the form of
$$y=ab^{x},\: \: where\: a\neq 0,b> 0$$
An exponential function with a > 0 and b > 1, like the one above, represents an exponential growth and the graph of an exponential growth function rises from left to right.
An exponential function where a > 0 and 0 < b < 1 represents an exponential decay and the graph of an exponential decay function falls from left to right.
When a quantity increases or decreases exponentially it increases or decreases by the same percent over equal time periods in comparison to when a compound increases or decreases linearly when a quantity increases or decreases with the same amount over equal time periods.
Video lesson
Graph the functions
$$y_{1}=3^{x}$$
$$y_{2}=3x$$