Graph functions and relations
In order to graph a linear equation we work in 3 steps:
First we solve the equation for y.
Second we make a table for our x- and y-values. From the x values we determine our y-values.
Last we graph our matching x- and y-values and draw a line.
Example
We are going to graph the equation -4x+2y=2.
First we solve the equation for y:
$$\begin{array}{lcl} -4x+2y & = & 2\\ -4x+2y+4x & = & 4x+2\\ 2y & = & 4x+2\\ \frac{2y}{2}& = & \frac{4x+2}{2}\\ y & = & 2x+1\\ \end{array}$$
Second we create our table:
x y=2x+1
-2 -3
0 1
2 5
In the table above we have used our values for x to determine our matching values for y by exchanging the x in the equation for our given x-value.
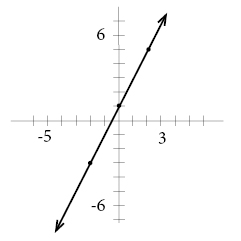
As a last step we graph our points in the coordinate plane and connect them with a straight line.
Video lesson
Graph the equation: y+2x=1