How to graph quadratic functions
A polynomial equation in which the highest power of the variable is 2 is called a quadratic function. We arrive at the following graph when we draw up a quadratic function such as y = x2:
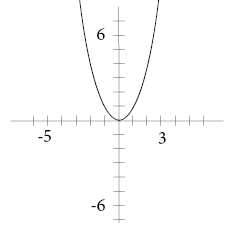
We can easily see that we are not dealing with a straight line but a parabola, thus it is referred to as a non-linear function. When one has a positive coefficient before x2 we have a minimum value, and if we have a negative coefficient we have a maximum value instead. See the graph below where y = -x2:
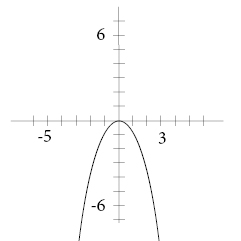
A rule of thumb reminds us that when we have a positive symbol before x2 we get a happy expression on the graph :) and a negative symbol renders a sad expression :( .
We graph our quadratic function in the same way as we graph a linear function. First we make a table for our x- and y-values. From the x values we determine our y-values.
Last we graph our matching x- and y-values and draw our parabola.
Video lesson
Graph f(x)=(x-4)2+1