Graphing linear inequalities
When you are graphing inequalities, you will graph the ordinary linear functions just like we done before. The difference is that the solution to the inequality is not the drawn line but the area of the coordinate plane that satisfies the inequality.
The linear inequality divides the coordinate plane into two halves by a boundary line (the line that corresponds to the function). One side of the boundary line contains all solutions to the inequality
The boundary line is dashed for > and < and solid for ≥ and ≤.
Example
Y ≤ 2x - 4
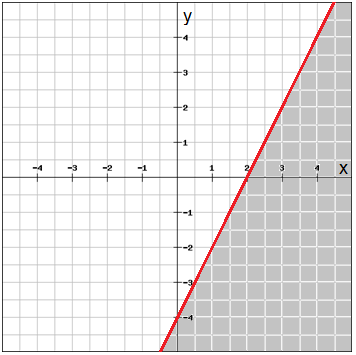
Here you can see that one side is colored grey and the other side is colored white, to determined which side that represent y ≤ 2x - 4, test a point.
We test the point (3;0) which is on the grey side.
$$y\leq 2x-4$$
$$0\leq 2\cdot 3-4$$
$$0\leq 6-4
$$0\leq 2$$
The grey side is the side that symbolizes the inequality y ≤ 2x - 4.
Video lesson
Graph the inequality y > 2 - 2x