Representing functions as rules and graphs
Let's begin by looking at an example:
At a store the carrots cost $2.50/lb. The price the customer pays is dependent on how many pounds of carrots that he buys. Another way to say this is to say that the total cost is a function of the pounds bought. We can write this as an equation.
$$total\: cost=price\: per\: lb\: \cdot \: weight\: bought$$
or
$$y=2.50\cdot x$$
A function is an equation which shows the relationship between the input x and the output y and where there is exactly one output for each input. Another word for input is domain and for output the range. As we stated earlier the price the costumer has to pay, y, is dependent on how many pounds of carrots, x, that the customer buys. The number of pounds bought is called the independent variable since that's what we're changing whereas the total price is called the dependent variable since it is dependent on how many pounds we actually buy.
Input variable = Independent variable = Domain
Output variable = Dependent variable = Range
Functions are usually represented by a function rule where you express the dependent variable, y, in terms of the independent variable, x.
$$y=2.50\cdot x$$
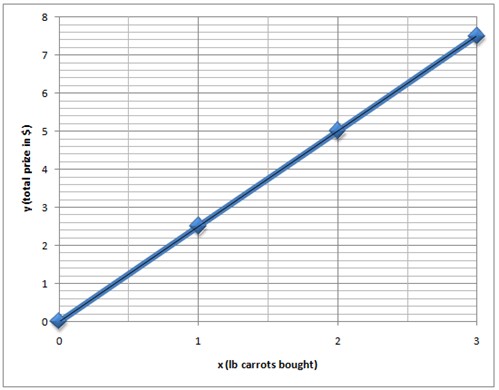
You can represent your function by making it into a graph. The easiest way to make a graph is to begin by making a table containing inputs and their corresponding outputs. Again we use the example with the carrots
| Input, x (lb) | Output, y ($) |
| 0 | 0 |
| 1 | 2.50 |
| 2 | 5.00 |
| 3 | 7.50 |
A pair of an input value and its corresponding output value is called an ordered pair and can be written as (a, b). In an ordered pair the first number, the input a, corresponds to the horizontal axis and the second number, the output b, corresponds to the vertical axis.
We can thus write our values as ordered pairs
(0, 0) - This ordered pair is also referred to as the origin
(1, 2.5)
(2, 5)
(3, 7.5)
These ordered pairs can then be plotted into a graph.
A pairing of any set of inputs with their corresponding outputs is called a relation. Every function is a relation, but not all relations are functions. In the example above with the carrots every input gives exactly one output which qualifies it as a function.
If you are insecure whether your relation is a function or not you can draw a vertical line right through your graph. If the relation is not a function the graph contains at least two points with the same x-coordinate but with different y-coordinates.
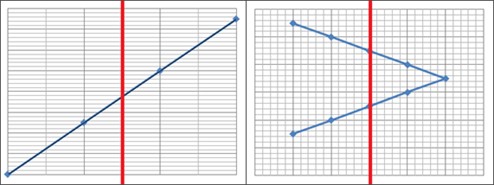
The relation portrayed in the graph to the left shows a function whereas the relation in the graph to the right is not a function since the vertical line is crossing the graph in two points.
Video lesson
Write a rule for the function:
| Input | 0 | 1 | 2 | 4 | 5 |
| output | 4 | 3 | 2 | 0 | -1 |