Linear inequalities in two variables
The solution of a linear inequality in two variables like Ax + By > C is an ordered pair (x, y) that produces a true statement when the values of x and y are substituted into the inequality.
Example
Is (1, 2) a solution to the inequality
$$2x+3y>1$$
$$2\cdot 1+3\cdot 2\overset{?}{>}1$$
$$2+5\overset{?}{>}1$$
$$7>1$$
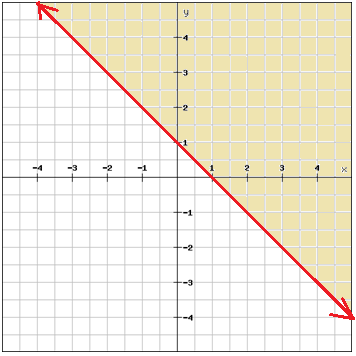
The graph of an inequality in two variables is the set of points that represents all solutions to the inequality. A linear inequality divides the coordinate plane into two halves by a boundary line where one half represents the solutions of the inequality. The boundary line is dashed for > and < and solid for ≤ and ≥. The half-plane that is a solution to the inequality is usually shaded.
Example
Graph the inequality
$$y\geq -x+1$$
Video lesson
Graph the linear inequality
$$y \geq 2x -3$$